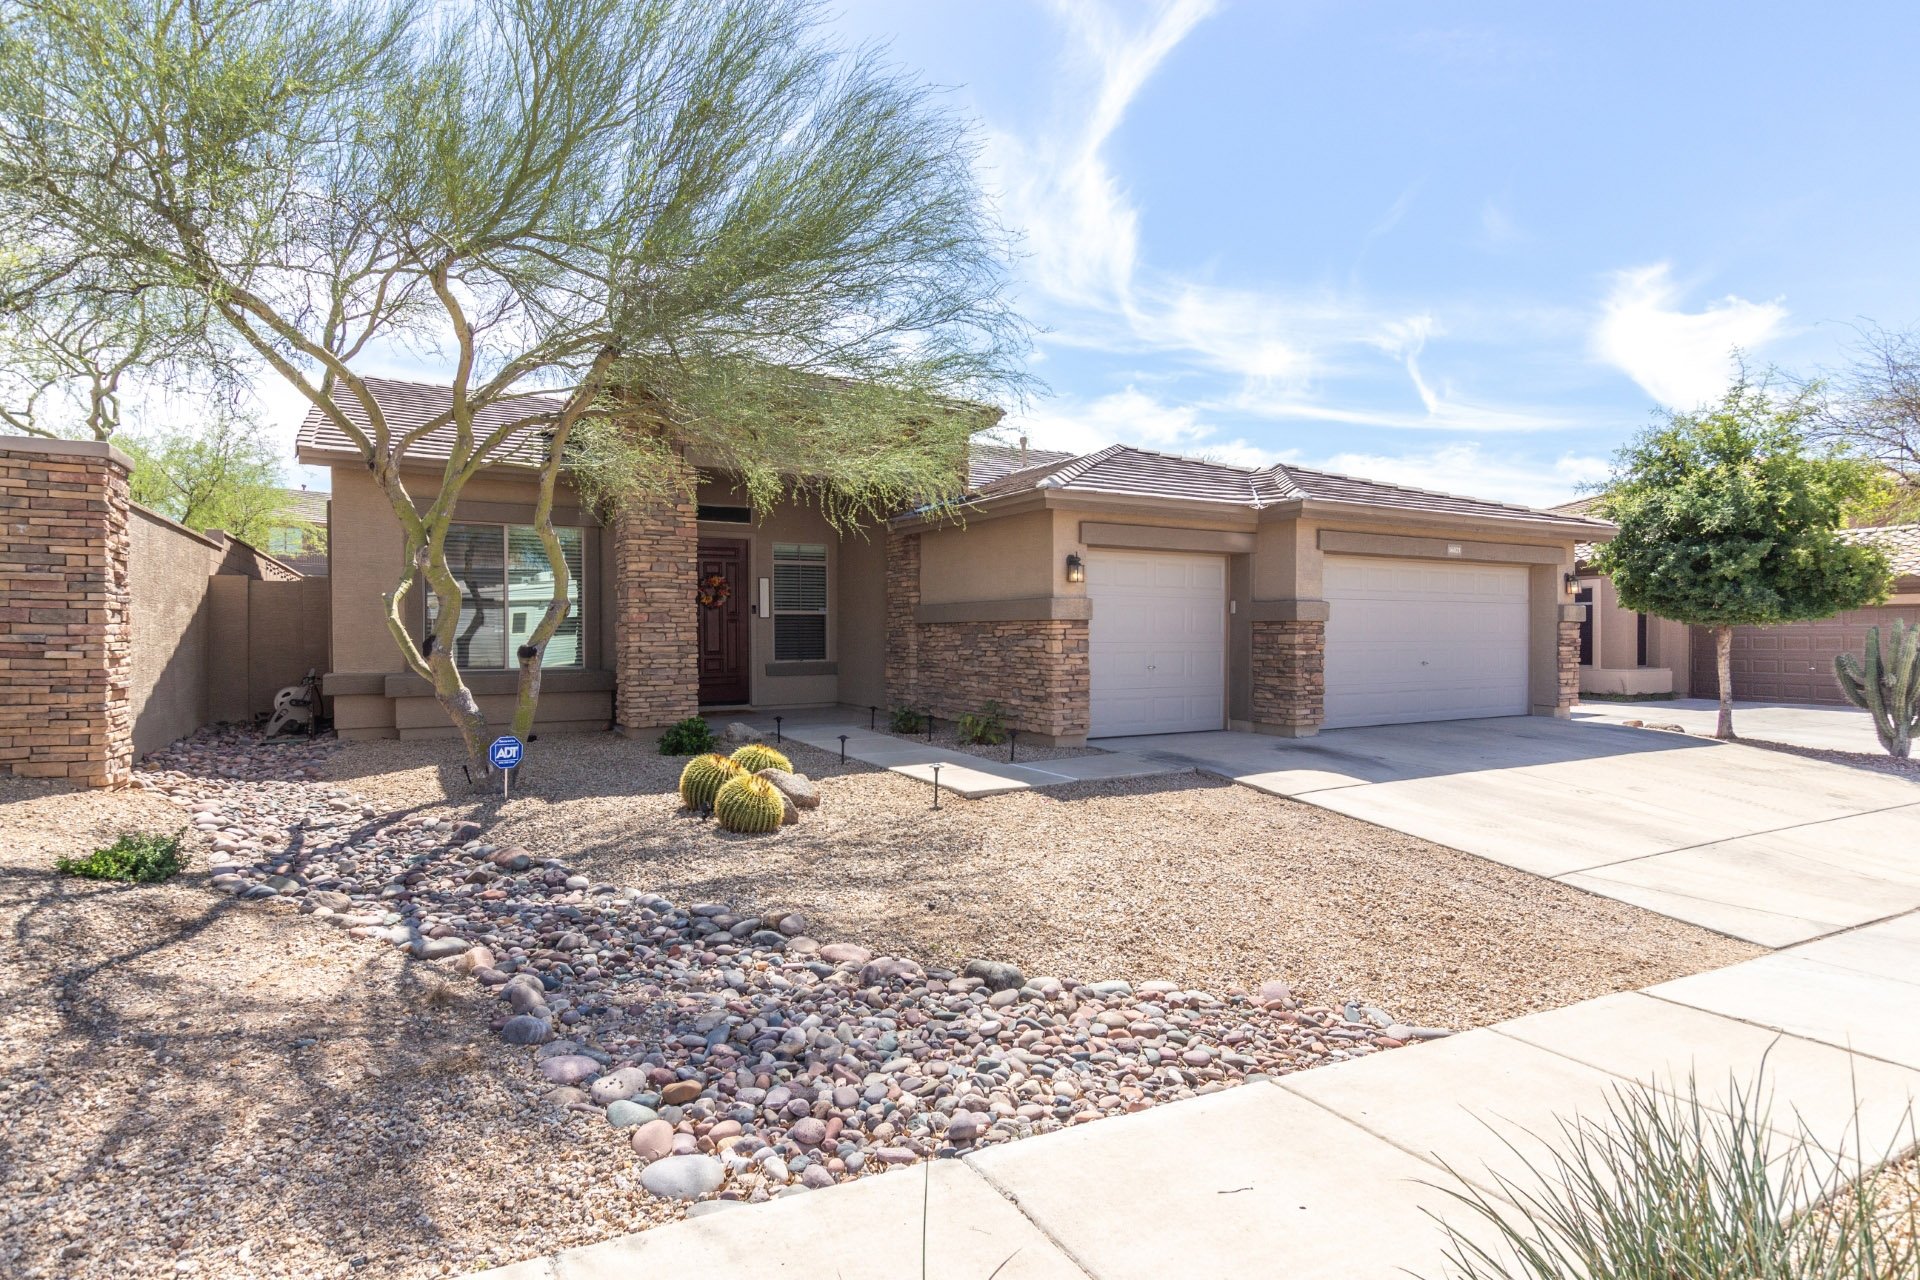
Growing up, I lived in two homes in a 20 year period. We were unusual, most of my friends didn’t move during that time but stayed in their home. Those who chose to stay in their home for the long haul seldom wondered what the current value of their home was. Usually the only time my parents had any indication of neighborhood values was when the Eichorn or Richard house at the end of our block sold – which was like never.
Residential real estate appreciation happens. Like the stock market, we see values increase and we have seen values decrease. Like the stock market, a long term real estate approach to creating wealth will (historically) always reward the patient. Once we moved into that second home in 1968, that was the last home my parents would ever own till my dad was near 90; Well over 30 years. Those were the days.
Tina Tamboer of “The Cromford Report,” at a recent seminar, used an interesting graph showing a 20 year Average Price Per Square Foot (PSF) and an appreciation cone showing where values would be today if there was a 2% or 3% annual appreciation each year.
After almost 20 years, since 2000, the graph shows the meteoric rise of values that hit $190 psf in 2006-2007, and the depths it plumbed to 4 years later near ($80 psf) in 2009-2011. The summer of 2011 was our bottoming out and for the next 8 years we have been in a period of consistent annual appreciation.
Human nature tends to look at this graph with regret. Why did I or why didn’t I… _____ Fill in your own regret blank! Is there a best? I think so, but it’s not the way I’ve gone for many mostly valid reasons which time and space don’t allow…btw, you’re welcome!
Conclusion? Enjoy your home each day while you can. If you need to sell, check out the numbers, but until then, it’s HOME, don’t day trade it!
Appreciation happens. So does life.


